
Understand your email analytics
Read the Email Analytics dashboard in Tantra. Learn what sent, clicked, replied, bounced, and unsubscribed mean and how fresh each number is.
Open in Tantra
These open the app in a new tab. You may be asked to sign in.
Overview
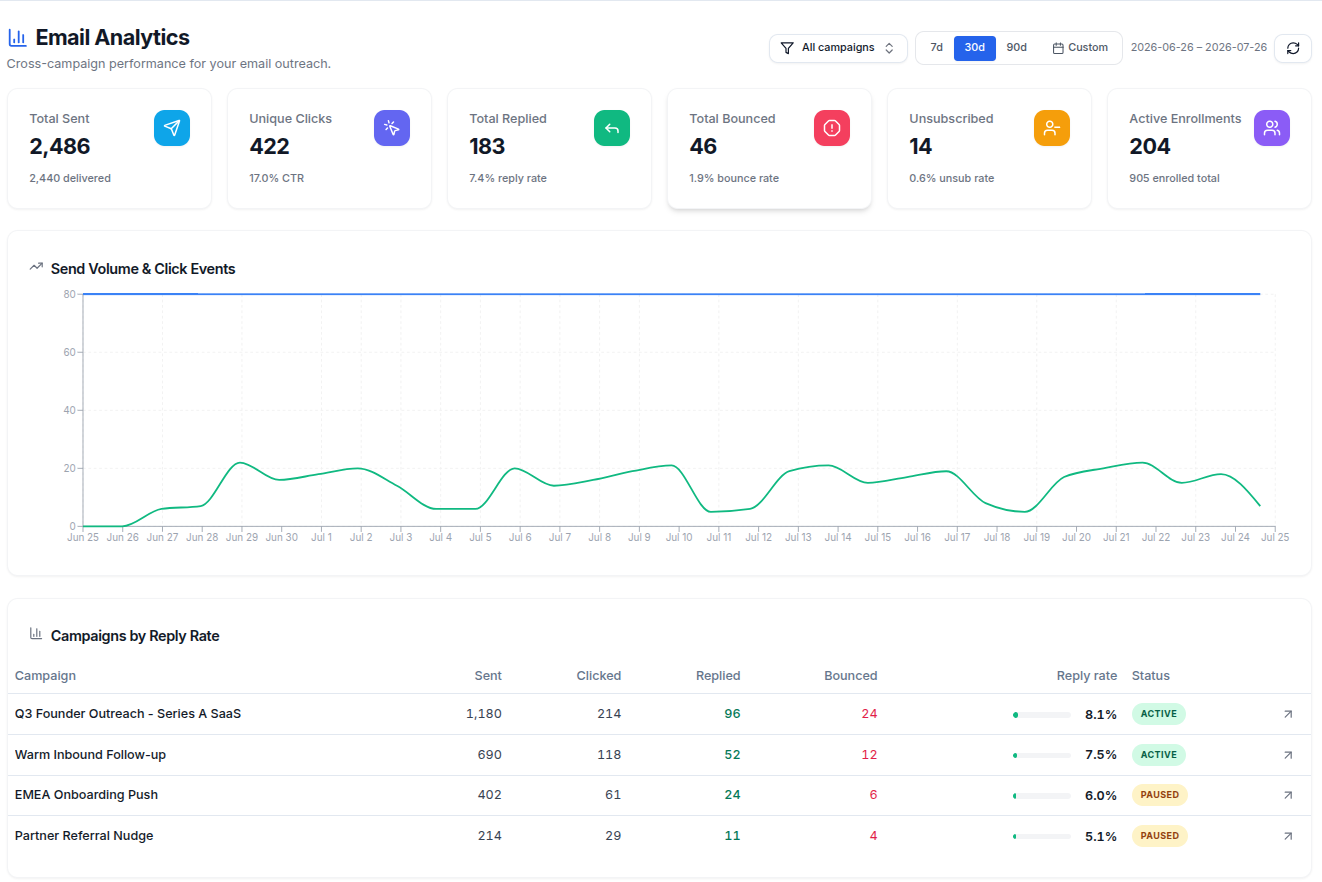
The Email Analytics page shows cross-campaign performance for your cold email outreach. It answers three questions. How much are you sending? Who is engaging? Which campaigns and mailboxes perform best?
Tantra measures engagement through clicks, replies, unsubscribes, and bounces. Tantra does not track opens. To learn why, read why Tantra does not track opens.
Open the page from the sidebar. If you have no email campaigns yet, you see a No email campaigns yet card with a Launch a campaign button instead of the dashboard.
How it works
Every number on this page comes from real events in your sending and inbox pipeline. Nothing is sampled or estimated, with one exception noted below.
- Sends are counted when a sequence step message actually leaves one of your connected mailboxes. Each successful send raises the campaign's sent counter by one.
- Clicks come from click tracking. Only the first non-bot click per enrolled recipient raises the clicked counter. Automated scanner clicks are filtered out.
- Replies and bounces come from reply detection. Tantra polls each sending mailbox, matches inbound messages to enrollments, and classifies each one as a genuine reply, a bounce, or an automatic response.
- Unsubscribes are counted when a recipient confirms an unsubscribe.
- Enrollments track each recipient's progress through your sequence. See the enrollment lifecycle.
The one derived number is delivered. Tantra has no separate delivery receipt, so delivered is calculated as sent minus bounced.
The page aggregates these counters across every campaign in view. Rates are calculated against sends. Reply rate is replies divided by sends, click-through rate is unique clicks divided by sends, and so on.
Screens and controls
Filters
Two filters sit at the top of the page, next to a refresh button.
- Campaign filter. Defaults to All campaigns. Open it to search and multi-select specific campaigns. Every tile, chart, and table then scopes to your selection. Use Clear to return to all campaigns. The page loads up to 100 campaigns.
- Date range. Preset buttons 7d, 30d, and 90d, plus a Custom picker with Start and End dates. The default is the last 30 days.
The date range applies only to click data, meaning the Recent Click Events table and the click line in the chart. The stat tiles and the campaign table always show lifetime totals for the campaigns in view. If a tile seems too high for your selected week, this is why.
Stat tiles
Six tiles summarize the campaigns in view.
| Tile | Value | Subtitle |
|---|---|---|
| Total Sent | Messages sent across all steps | Delivered count, calculated as sent minus bounced |
| Unique Clicks | Recipients who clicked at least one tracked link | CTR, unique clicks divided by sends |
| Total Replied | Genuine replies detected in your mailboxes | reply rate, replies divided by sends |
| Total Bounced | Messages that bounced | bounce rate, bounces divided by sends |
| Unsubscribed | Recipients who unsubscribed | unsub rate, unsubscribes divided by sends |
| Active Enrollments | Enrollments still moving through a sequence, calculated as enrolled minus completed | Total enrolled count |
Send Volume & Click Events chart
A line chart across your selected date range with two lines.
- Click events plots actual non-bot clicks per day. This line is real event data.
- Sent (avg/day) spreads the lifetime sent total evenly across the days in your range. It is a flat baseline, not a true per-day send series. Do not read it as daily send volume.
When there is no data the chart shows No volume data for this range yet.
Campaigns by Reply Rate
A table ranking every campaign in view, best reply rate first. Columns are Campaign, Sent, Clicked, Replied, Bounced, Reply rate, and Status. Status badges show active, paused, draft, or completed. The arrow icon on each row opens that campaign's detail page.
Per-Sender Activity
A bar chart of your busiest sending mailboxes, up to ten, with Sent, Replied, and Bounced bars per mailbox. Sends are grouped by the mailbox that sent them. Replies and bounces are grouped by the mailbox that received them. Use this to spot a mailbox with an unusually high bounce share.
Reply Intent Breakdown
A donut chart splitting classified replies into Positive, Neutral, Negative, and Unknown. Each detected reply carries a sentiment hint. Keyword matching assigns it first, and the AI classifier overrides it when the model is confident. Replies without a recognizable sentiment count as Unknown. Before any replies are classified the panel reads No classified replies yet.

Recent Click Events
A paginated list of individual clicks, newest first, 25 rows per page. The header shows the total as non-bot clicks. Columns are Occurred, URL, Tracking Host, and User Agent. Bot clicks are excluded from this list. The date range filter applies here. An empty range shows No click events recorded for this range.
What happens next
The dashboard is near real time, but each metric has its own freshness.
- Sends register the moment a message is sent, then appear on the page within about a minute.
- Clicks are recorded within seconds of the recipient clicking and appear within about a minute.
- Replies and bounces wait on inbox polling. Mailboxes that sent within the last 3 days are checked about every 30 seconds. Older mailboxes are checked less often, stretching to 10 minutes, then 30 minutes, then hourly. A reply can therefore take from under a minute to about an hour to appear, depending on how recently that mailbox sent.
- The server caches analytics responses for 60 seconds. The refresh button re-requests everything, but a number can still be up to a minute old.
Watch the Total Replied tile and the Reply Intent Breakdown panel after a send wave. Replies typically start landing within hours, and the intent split tells you whether the copy resonates.
Best practices
- Judge campaigns on reply rate first. The Campaigns by Reply Rate table already ranks them for you. Clicks signal interest, but replies are the outcome cold email exists for.
- Watch bounce rate per mailbox in Per-Sender Activity. One bad mailbox or stale list segment can drag down a whole domain's reputation.
- Treat a rising Negative or Unknown share in the intent breakdown as a copy or targeting signal, not noise.
- Compare Active Enrollments with Total Sent to see how much of your pipeline is still in flight.
Common mistakes
- Expecting the stat tiles to follow the date range. They show lifetime totals for the campaigns in view. Only click data follows the date filter.
- Reading Sent (avg/day) as a daily send report. It is the lifetime total averaged across the range.
- Expecting open rates. Tantra does not track opens by design. See why Tantra does not track opens.
- Comparing Unique Clicks with raw click counts from other tools. Tantra counts one click per recipient and excludes bot clicks, so its number is lower and more honest.
Troubleshooting
| Symptom | Cause | Fix |
|---|---|---|
| Red banner reading Failed to load analytics | A request to the analytics API failed | Click Retry in the banner or the refresh button. Check your connection if it persists. |
| No email campaigns yet card instead of the dashboard | You have no email campaigns | Click Launch a campaign and create your first sequence. |
| Table shows No campaigns to rank yet. | Your campaign filter selection matches no campaigns | Open the campaign filter and click Clear. |
| A reply exists in the mailbox but Total Replied has not moved | The mailbox is on a slower polling tier, or the 60 second cache has not expired | Wait a few minutes. Recently active mailboxes update within about a minute. |
| Click count seems low | Only the first non-bot click per recipient counts | This is expected. See how click tracking works. |
| Tiles show more than the selected week | Tiles are lifetime totals, not date filtered | Use the Recent Click Events table for date scoped click activity. |
FAQ
Does the dashboard show open rates? No. Tantra does not track opens. Engagement is measured through clicks, replies, unsubscribes, and bounces.
How fresh are the numbers? Sends and clicks appear within about a minute. Replies and bounces depend on inbox polling, from about 30 seconds for recently active mailboxes up to an hour for dormant ones. All responses are cached for 60 seconds.
What does the delivered number mean? Sent minus bounced. There is no separate delivery receipt, so this is the closest available measure.
Why do the tiles ignore my date range? The stat tiles and campaign table read lifetime counters per campaign. The date range scopes only the click events table and the click line in the chart.
What counts as a reply? An inbound message that reply detection classifies as a genuine human reply. Bounces, out-of-office notices, and other automatic responses are excluded. See how reply detection works.
Can I analyze one campaign at a time? Yes. Use the campaign filter to select any subset of campaigns. Every panel scopes to your selection.
Why is a mailbox missing from Per-Sender Activity? The chart shows the ten mailboxes with the most sends in the campaigns in view. Mailboxes with no sends and no inbound activity do not appear.
Related articles
Was this article helpful?
Related articles
- How click tracking worksLearn how Tantra rewrites links, verifies signed click tokens, filters bot clicks, and shows unique click engagement in analytics.
- Reply detection and intent classificationLearn how Tantra polls your mailboxes to detect replies, links them to the right campaign, and classifies each one with AI and a keyword fallback.
- Enrollment lifecycle and statusesUnderstand how a contact moves through a Tantra cold email sequence, what each enrollment status means, and how to manage enrollments.